Faster month-end closes. Fewer late nights. Reports your board actually reads.
Turn any General Ledger export into board-ready financial reports — in minutes. Works with Xero, QuickBooks, Sage, and any ERP that exports to Excel.
| METRIC | JAN | FEB | MAR | YTD |
|---|---|---|---|---|
| Gross Margin % | +65.2% | +65.5% | +62.2% | +64.2% |
| EBITDA Margin % | +22.8% | +23.0% | +21.0% | +22.2% |
| EBIT Margin % | +19.2% | +19.4% | +17.3% | +18.6% |
| Net Profit Margin % | +15.6% | +15.2% | +13.6% | +14.7% |
| COGS as % of Revenue | 34.8% | 34.5% | 37.8% | 35.8% |
| Total OpEx Ratio | 42.4% | 42.4% | 41.2% | 42.0% |
| METRIC | OPENING | JAN | FEB | MAR |
|---|---|---|---|---|
| Current Assets | 497,400 | 533,300 | 594,600 | 670,900 |
| Current Liabilities | 90,900 | 100,500 | 102,400 | 117,300 |
| Net Working Capital | 406,500 | 432,800 | 492,200 | 553,600 |
| Current Ratio | 5.5x | 5.3x | 5.8x | 5.7x |
| Cash Balance | 312,000 | 360,200 | 412,800 | 473,900 |
| METRIC | OPENING | JAN | FEB | MAR |
|---|---|---|---|---|
| AR Balance (closing) | 185,400 | 173,100 | 181,800 | 197,000 |
| Revenue (monthly) | — | 265,200 | 278,400 | 298,900 |
| AR as % of Revenue | — | 65.3% | 65.3% | 65.9% |
| REVENUE CATEGORY | JAN | FEB | MAR | YTD |
|---|---|---|---|---|
| Product Sales | 185,000 | 194,200 | 208,500 | 587,700 69.8% |
| Service Revenue | 72,400 | 76,800 | 81,200 | 230,400 27.3% |
| Other Income | 7,800 | 7,400 | 9,200 | 24,400 2.9% |
| Total Revenue | 265,200 | 278,400 | 298,900 | 842,500 |
| METRIC | JAN | FEB | vs Jan | MAR | vs Feb |
|---|---|---|---|---|---|
| Revenue | 265,200 | 278,400 | +5.0% | 298,900 | +7.4% |
| Cost of Sales | (92,300) | (96,100) | +4.1% | (112,900) | +17.5% |
| Gross Profit | 172,900 | 182,300 | +5.4% | 186,000 | +2.0% |
| OpEx | (112,400) | (118,200) | +5.2% | (123,200) | +4.2% |
| EBITDA | 60,500 | 64,100 | +6.0% | 62,800 | −2.0% |
| METRIC | OPENING | JAN | FEB | MAR |
|---|---|---|---|---|
| Total Assets | 591,400 | 624,500 | 683,000 | 756,500 |
| Total Liabilities | 90,900 | 100,500 | 102,400 | 117,300 |
| Capital & Reserves | 500,500 | 524,000 | 580,600 | 639,200 |
| Net Equity | 500,500 | 524,000 | 580,600 | 639,200 |
Stop copying between spreadsheets. Add unlimited entities, each with its own GL model. Consolidate any combination in one click.
Run entities in GBP, USD, EUR, TRY, ZAR, SGD, BRL, CAD, or MXN. FX rates auto-fetch with one click — the Report Pack handles the conversion automatically.
No installation. No login. No IT department. Just one HTML file that runs in your browser — online or offline.
Build your reporting structure once. Map every GL code to categories, sub-categories, and cost centre buckets. Export and reuse across entities.
Export from Xero, QuickBooks, Sage, or any ERP — drop the file in and the tool maps account codes, dates, and amounts automatically.
Generate a read-only shareable version that stakeholders can view in their browser without editing your data. Board members see the reports — you keep control.
Pull your standard reports from Xero, QuickBooks, Sage, or any accounting system — transactions, opening balances, chart of accounts, aged receivables, and aged payables. Files you already run every month.
Open the Report Pack in your browser and upload your files. First time only: map your GL codes to reporting categories. After that, the mapping saves automatically.
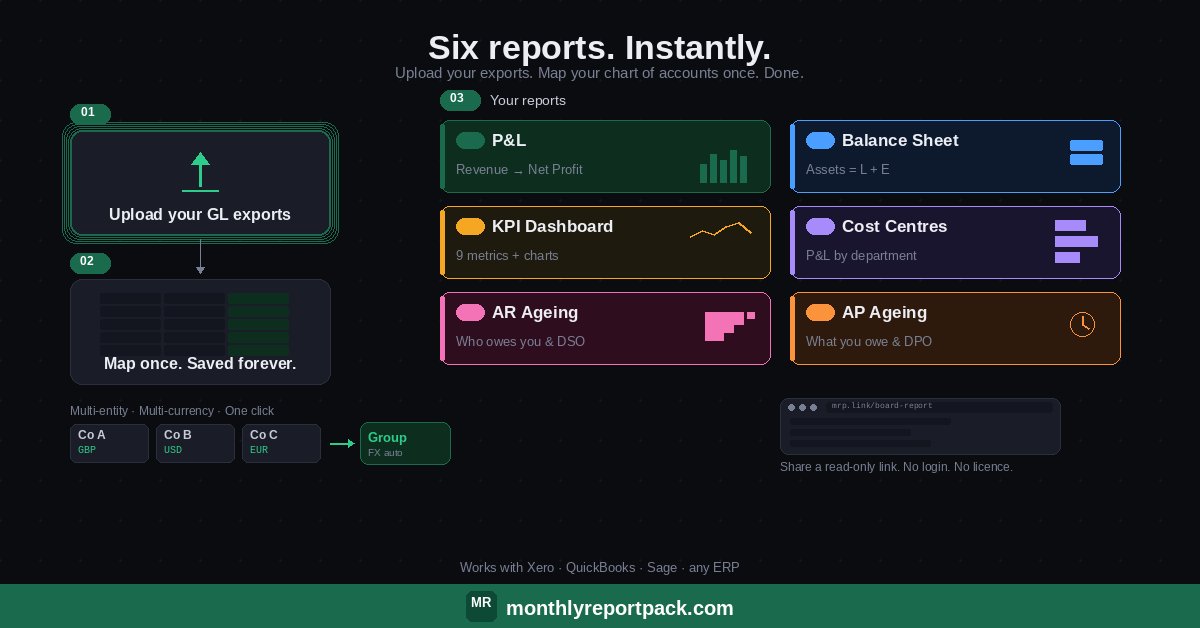
Six reports — instantly. Share a read-only link with your board. Done.
Revenue to Net Profit, broken down by category and sub-category. Monthly columns, YTD totals, and key subtotals at Gross Profit, EBITDA, and EBIT.
Assets, Liabilities, and Capital & Reserves — with opening balances, monthly movements, and closing positions side by side.
A full financial dashboard — not just a few numbers. Nine headline KPI cards plus seven analytical sections covering profitability ratios, working capital, receivables, revenue breakdown, and month-on-month variance. The page your board looks at first.
See where money is being spent. Your P&L split into functional buckets so you can spot which departments are driving costs.
See who owes you money and how long it's been outstanding. Upload your Aged Receivables Detail and get instant visibility on collection risk.
Track what you owe and when it's due. Upload your Aged Payables Detail to monitor payment obligations and supplier exposure.
Trusted by finance teams across 5 countries
Trusted by teams managing 200+ entities
🔒 Secure checkout via Stripe · Instant access after payment
Questions? Email info@monthlyreportpack.com
Any system that exports a General Ledger Detail report as an Excel file. Works with Xero, QuickBooks, Sage, and any other accounting platform.
Five files per entity: Account Transactions (GL Detail), Opening Balances, GL Chart of Accounts (or use the built-in GL Modelling), Aged Receivables for AR Ageing, and Aged Payables for AP Ageing. All are standard exports from any ERP.
No. Everything runs locally in your browser. No servers, no cloud, no tracking. Your financial data never leaves your machine.
Yes, with the Full version. Add as many entities as you need, each with its own GL model. Consolidate any combination in one click. The Lite version supports a single entity.
The Full version supports GBP, USD, EUR, TRY, ZAR, SGD, BRL, CAD, and MXN with auto-fetch FX rates. The Lite version supports a single currency — GBP, USD, or EUR.
As this is a digital product, refunds are assessed case by case. If the product doesn't work as described, email info@monthlyreportpack.com and we'll make it right.